

Mimir
Asgard Data Insight
- Semantic Model
- Describes the tables, what each field means and which measures exist. Built and published in Odin. One project can carry several semantic models.
- OdinAsgard Studio
- IT and the FDE build semantic models in Odin. A semantic model records what each field means and how the tables relate.
- SindriAsgard Agents Hub
- The agents in Sindri use the same semantic model. A metric is calculated the same way in Mimir and by the agents. Change it once, it changes everywhere.
- Project
- The project switcher at the top decides which data you query. Switch it and the whole sidebar follows.
- Examples and rulesKnowledge
- Your company's usual lookups are saved as question-and-SQL examples, and Mimir follows them for similar questions. Rules apply to every question, or only when a question matches a condition.
- ReportsView and Dashboard
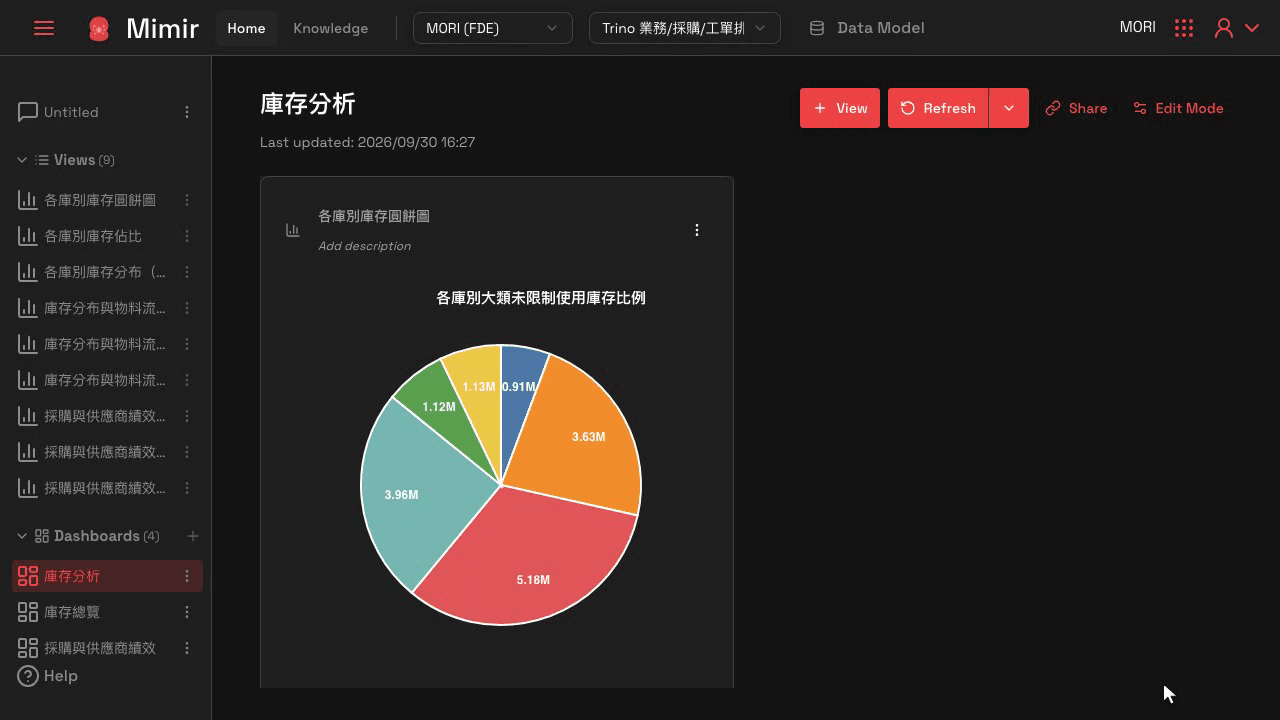
- A useful answer can be saved as a view: the chart together with the SQL behind it. A dashboard arranges several views, and opening it shows current numbers.
How it works
How a question is answered
- 01
Interpret the question
Work out which metric and which period. - 02
Map to the semantic model
Find the metrics and fields the semantic model defines, such as order count and city. - 03
Generate SQL
Write the query from those definitions. The query expands to read. - 04
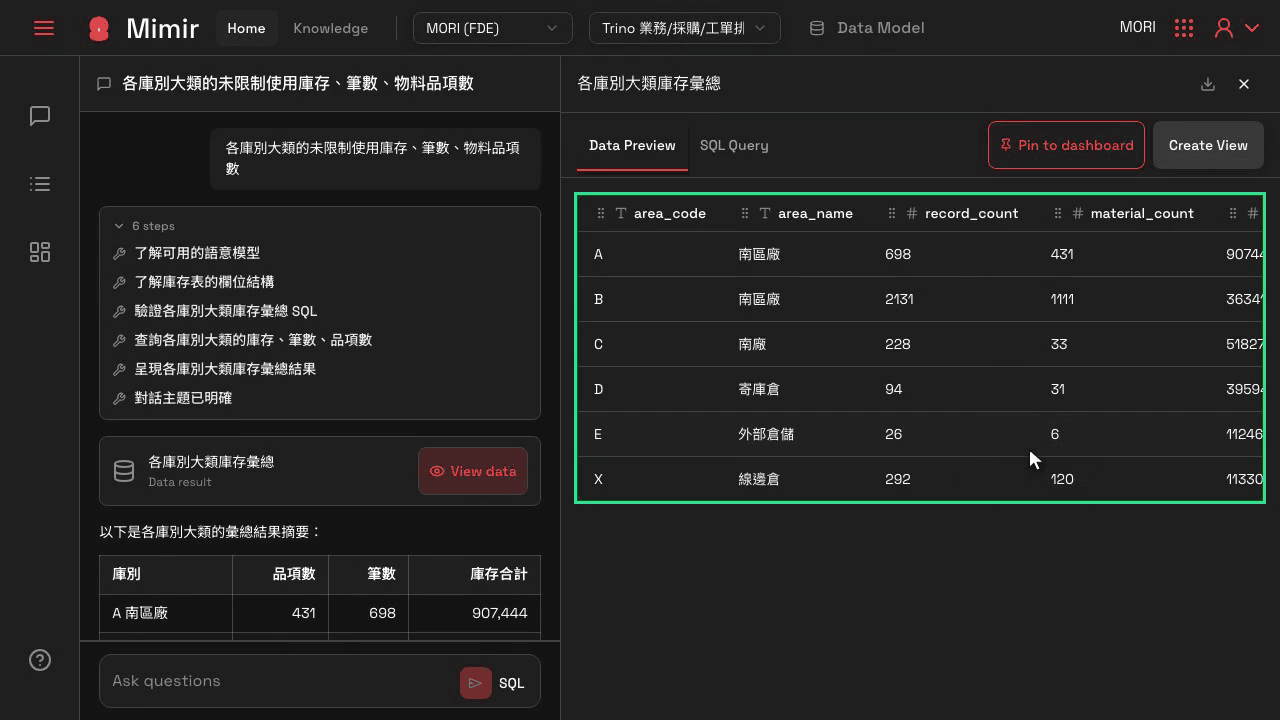
Run and answer
Return the result, with follow-up questions offered. A poor answer can be marked not helpful on the spot. - 05
Chart it
Say make a chart, and Mimir picks the type, maps the fields and draws it.
Product
Mimir in action
1 / 3
Arrow keys or swipe


Start here
Book a two-hour workshop
AI feasibility review of a live workflow